Oil prices stumbled on Thursday despite news of growing draws from US oil inventories last week and major oil production outages across the US Lower 48 this week.
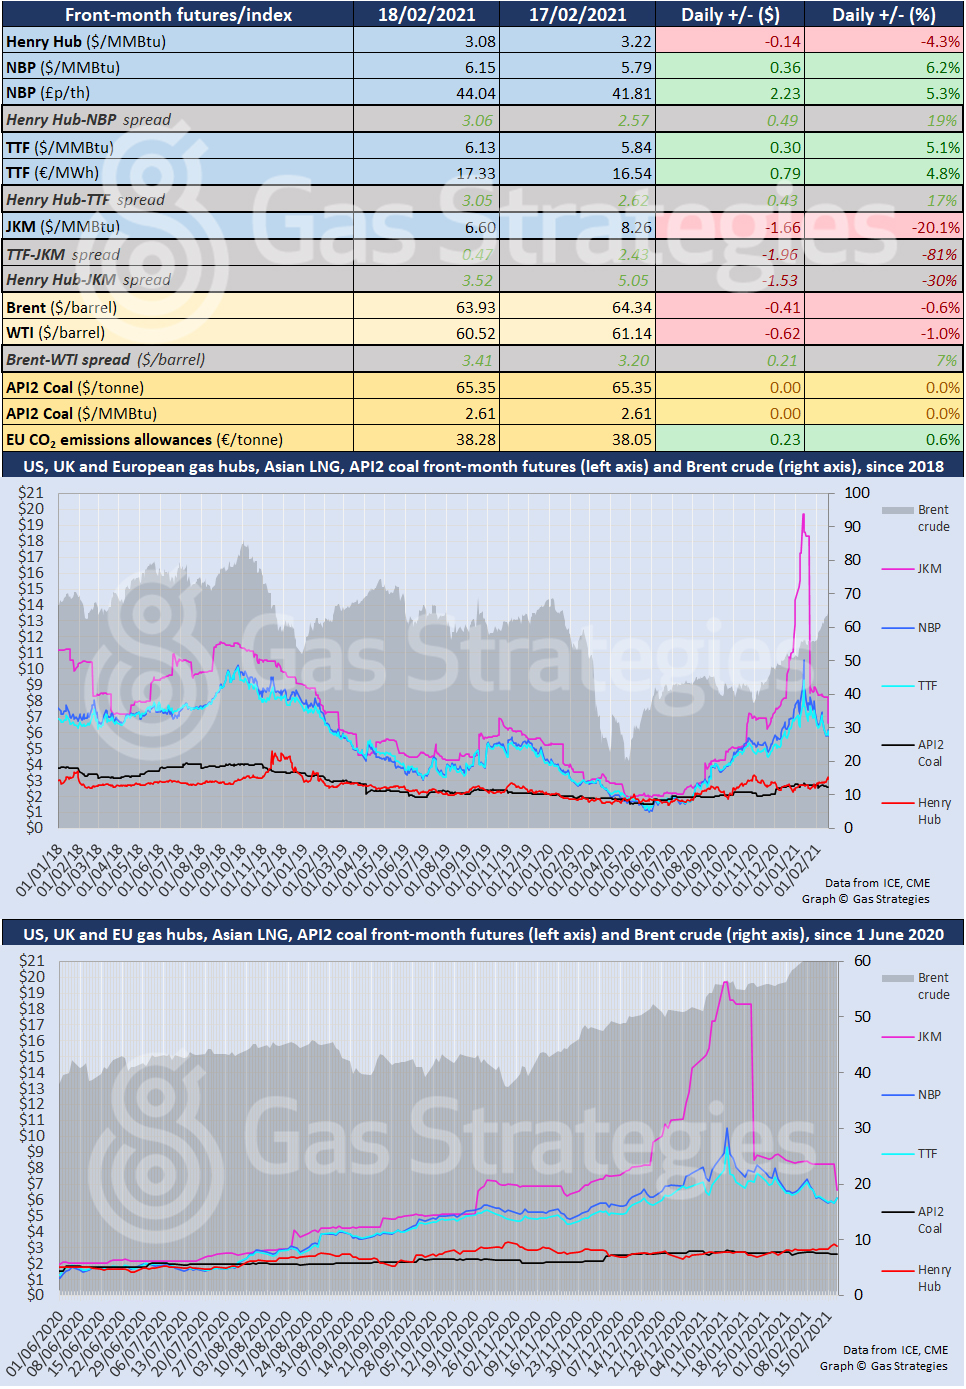
The front-month WTI contract rallied to a 13-month high of USD 62.26/barrel during the session, however the price fell USD 0.62/barrel to settle at USD 60.52/barrel. Brent also hit a 13-month high of USD 65.52/barrel during yesterday’s session before falling by USD 0.41/barrel to settle at USD 63.93/barrel.
The price surge during the session was attributed to news from the US Energy Information Administration (EIA), which reported that US oil inventories fell by 7.3 million barrels last week. This compares with a draw of 5.5 million barrels during the previous week.
The crude price slump on Thursday was attributed to market participants cashing in on the price surge in recent days, which has been driven by large scale production cuts across the US Lower 48 caused by the polar vortex.
US natural gas benchmark Henry Hub took a tumble on Thursday, with the front-month contract falling by 4.3%, but remaining in the USD 3/MMBtu range.
Front-month European gas prices rallied on Thursday, with falling gas storage levels and curbs on US LNG exports driving the increase. The month-ahead UK NBP price rallied by 6.2%, and the month-ahead Dutch TTF rallied by 5.1%, with both markers returning to the USD 6/MMBtu range.
CME’s JKM futures contract rolled over to April, with the price settling 4.7% higher day-on-day at USD 6.6/MMBtu.
The European carbon price stopped the rot after rallying by 0.6% to close at EUR 38.28/tonne.
Front-month futures and indexes at last close with day-on-day changes (click to enlarge):

Time references based on London GMT. Brent, WTI, NBP, TTF and EU CO2 data from ICE. Henry Hub, JKM and API2 data from CME. Prices in USD/MMBtu based on exchange rates at last market close. All monetary values rounded to nearest whole cent/penny. Text and graphic copyright © Gas Strategies, all rights reserved.